2409.HK


Stock code
2409.HK
The Schedule Reliability in Main Trades
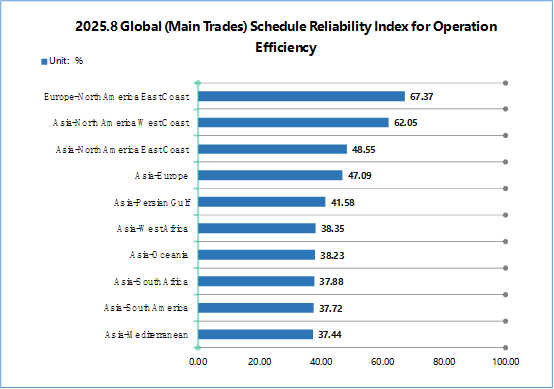
After a slight decline for several consecutive months, the Global (Main Trades) Overall Schedule Reliability Index continued to fall in August, closing at 44.21%, a decrease of 0.85 percentage points compared to the previous month. The Schedule Reliability for Operation Efficiency closed at 48.17%, up 0.28 percentage points from the previous month.
|
2025.8 Global (Main Trades) Overall Schedule Reliability Index |
|||
|
Index |
Previous period |
Current period |
Comparison |
|
Overall Schedule Reliability Index % |
45.06 |
44.21 |
-0.85 |
|
Schedule Reliability Index for Commercial Commitment% |
42.23 |
40.24 |
-1.98 |
|
Schedule Reliability Index for Operation Efficiency% |
47.89 |
48.17 |
0.28 |
|
2025.8 Global (Main Trades) Schedule Reliability Index for Commercial Commitment & Operation Efficiency |
||||||
|
Trade |
Schedule Reliability for Commercial Commitment% |
Schedule Reliability for Operation Efficiency% |
||||
|
Previous period |
Current period |
Comparison |
Previous period |
Current period |
Comparison |
|
|
Asia—Europe |
34.15 |
37.02 |
2.86 |
43.95 |
47.09 |
3.15 |
|
Asia—Mediterranean |
30.76 |
25.38 |
-5.38 |
39.37 |
37.44 |
-1.93 |
|
Asia—North America West Coast |
56.55 |
53.87 |
-2.68 |
61.62 |
62.05 |
0.43 |
|
Asia—North America East Coast |
37.56 |
40.03 |
2.48 |
46.34 |
48.55 |
2.21 |
|
Asia—Persian Gulf |
42.29 |
41.91 |
-0.38 |
39.89 |
41.58 |
1.69 |
|
Asia—Oceania |
46.48 |
41.77 |
-4.70 |
42.35 |
38.23 |
-4.12 |
|
Asia—West Africa |
33.33 |
30.22 |
-3.11 |
40.13 |
38.35 |
-1.79 |
|
Asia—South Africa |
41.82 |
37.99 |
-3.82 |
48.98 |
37.88 |
-11.10 |
|
Asia—South America |
43.83 |
38.09 |
-5.74 |
35.59 |
37.72 |
2.12 |
|
Europe—North America East Coast |
70.35 |
65.85 |
-4.49 |
72.62 |
67.37 |
-5.26 |
Carriers & Alliances’ Schedule Reliability
In August, the Schedule Reliability for Operation Efficiency of the top 13 global carriers showed more declines than gains. Maersk ranked first in both the Schedule Reliability for Operation Efficiency and Commercial Commitment, at 63.67% and 65.21%, down 6.05 and 5.34 percentage points from the previous month respectively. Hapag-lloyd ranked second in both the Schedule Reliability for Operation Efficiency and Commercial Commitment, at 57.65% and 56.95%, down 12.49 and 8.51 percentage points from the previous month respectively. COSCO Shipping's Schedule Reliability for Operation Efficiency ranked third, at 52.96%, an increase of 4.21 percentage points compared to the previous month.
In August, among the new three major alliances, the Gemini Alliance performed outstandingly in terms of schedule reliability, ranking first in both the Schedule Reliability for Operation Efficiency and Commercial Commitment, at 70.02% and 68.14% respectively. While, Ocean Alliance ranked second in both the Schedule Reliability for Operation Efficiency and Commercial Commitment, at 30.27% and 51.33% respectively.
|
2025.8 Global (Main Trades) Overall Schedule Reliability Index |
||||||
|
Carrier |
Schedule Reliability for Commercial Commitment % |
Schedule Reliability for Operation Efficiency % |
||||
|
Previous period |
Current period |
Comparison |
Previous period |
Current period |
Comparison |
|
|
CMA CGM |
37.44 |
37.20 |
-0.24 |
48.33 |
48.22 |
-0.11 |
|
COSCO SHIPPING |
43.64 |
36.42 |
-7.21 |
48.75 |
52.96 |
4.21 |
|
EVERGREEN |
39.54 |
41.25 |
1.71 |
39.38 |
51.08 |
11.70 |
|
HAPAG-LLOYD |
65.46 |
56.95 |
-8.51 |
70.14 |
57.65 |
-12.49 |
|
HMM |
8.13 |
8.90 |
0.77 |
17.28 |
23.39 |
6.11 |
|
Maersk |
70.55 |
65.21 |
-5.34 |
69.72 |
63.67 |
-6.05 |
|
MSC |
21.76 |
24.41 |
2.65 |
25.49 |
25.18 |
-0.31 |
|
ONE |
31.53 |
37.04 |
5.51 |
44.44 |
43.78 |
-0.66 |
|
OOCL |
44.96 |
41.09 |
-3.87 |
45.64 |
50.28 |
4.64 |
|
PIL |
36.22 |
28.99 |
-7.24 |
31.30 |
24.53 |
-6.78 |
|
WAN HAI |
14.10 |
18.78 |
4.68 |
23.91 |
30.61 |
6.70 |
|
YANG MING |
33.82 |
26.17 |
-7.64 |
40.60 |
45.00 |
4.40 |
|
ZIM |
37.65 |
34.91 |
-2.75 |
44.54 |
39.29 |
-5.25 |
|
Ocean Alliance |
30.15 |
30.27 |
0.11 |
45.29 |
51.33 |
6.04 |
|
Gemini Alliance |
76.72 |
70.02 |
-6.69 |
77.69 |
68.14 |
-9.54 |
|
Premier Alliance |
26.67 |
26.74 |
0.07 |
40.38 |
43.75 |
3.37 |
Main ports’ Schedule Reliability
In August, the top three ports in terms of the Overall Service Performance were Tangier Port, Singapore Port and Shenzhen Port. Among them, Tangier Port’s Overall Service Performance was 2.03, ranking first, whose Schedule Reliability and Number of Port Call were 69.23% and 208 respectively. Singapore Port’s Overall Service Performance was 1.74. whose Schedule Reliability and Number of Port Call were 39.37% and 315 respectively. The Number of Port Call at Shenzhen Port was 288, whose the Average Port Time was 1.44 days.
Source: xinde marine news